NFT Yearly Report 2019 is live!
We are extremely proud and excited to announce the official release of our 2019 Annual Report on the non-fungible token ecosystem. The purpose of this report is to give everyone all the keys to understanding the dynamics and forces that govern the NFT ecosystem economy.
This article provides additional analysis to go further and highlight the trends observable in the report.
- Do players regularly play blockchain games?
- Between art, RPG and collectibles which sector is driving the growth of NFT?
- How can we track the overall performance of a blockchain application? What are the metrics to monitor?
- Which projects are the “whales” investing in?
- What type of assets do players speculate on most?
- What is the overall liquidity of the NFTs? And by project?
- What has been the evolution of the NFT Market Cap since the creation of the standard in 2017?
- What can we hope for in 2020? What are the market forecasts?
Download the NFT Yearly Report 2019
Observation #1 – 2019 has been a year of stabilization
The first observation in 2019 is that the overall figures for the year may appear to be below expectations, with a 4% drop in USD traded compared to 2018 and an increase of only 1% regarding active addresses through the year.
These results echo the first trends observed in the first half of 2019, and analyzed in our dedicated article.
Our analysis of these numbers is that the ecosystem continues to stabilize following the pre-sale craze that followed the ICO frenzy.
Projects continue to multiply (as made evident by the number of active Smart Contracts), the resulting UX are gradually being resolved, the ecosystem is currently in a phase of consolidation and stabilization. We believe that the industry continues to gain maturity in terms of user experience, good practices, and that it is preparing overall for the challenges that await it in the coming years for mass adoption.
Observation #2 – Leaders are heckled by newcomers
We found the major projects we knew in 2018 without much surprise, but most of them had to leave first place on the podium for a new entrant or a project that has been able to strengthen their position during the year.
- CryptoKitties remains by far the leader in terms of transactions over the past year, but we can observe a gradual erosion of its volumes during 2019, going from nearly 300,000 transactions per month to just under 100,000.
- Decentraland, which seemed unbeatable from a USD transferred volume standpoint, has given way to two new players who hit the markets in 2019: Gods Unchained and Ethereum Name Service.
- My Crypto Heroes maintains its first place in terms of community size with more than 15,000 players over the year, but closely followed by CryptoKitties.
Observation #3 – Three (3) projects bring together 50% of the players
Between January and December 2019, CryptoKitties, 0xUniverse and MyCryptoHeroes 4 times represent more than 50% of the entire blockchain gaming community on Ethereum.
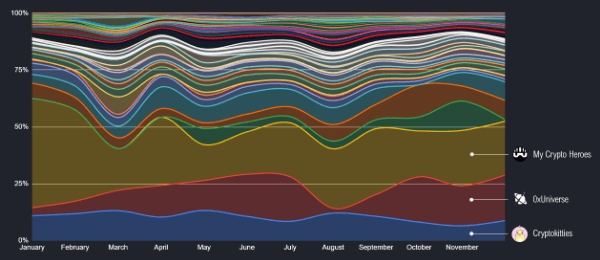
This is the reflection of an ecosystem that is still very polarized around historic players. Note, however, a gradual depolarization compared to the first half of 2018.
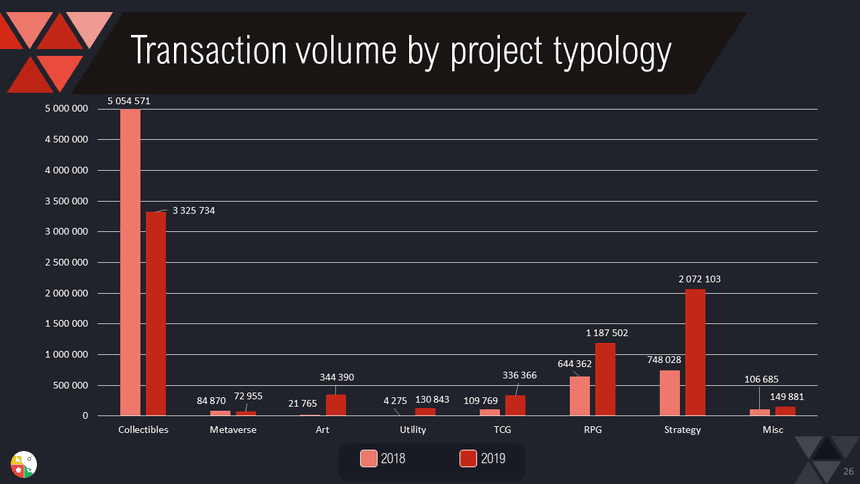
Observation #4 – The exhaustion of collectibles
Collectibles were more or less the first major use case of NFT with CryptoPunks and CryptoKitties followed by the hundreds of projects and initiatives which followed with more or less success.
The volumes by project type highlighted the collapse of collectibles in favor of other use cases.
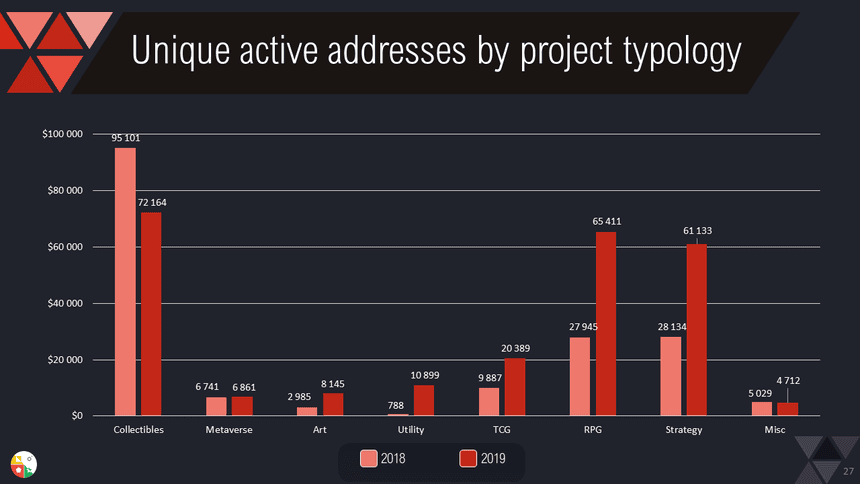

Observation #5 – Art, TCG & RPG – The major trends for the upcoming years?
Conversely, the projects mixing Art and Blockchain have experienced a certain boom, seeing their statistics more than triple during the year. Although volumes remain small compared to other project typologies, this growth is one of the strongest identified over the year.
RPGs came in second place in terms of player volumes, while TCGs more than doubled their transaction volume and active addresses.
Observation #6 – Whales are (slowly) diversifying their portfolio
Most of the speculation has been going on Decentraland so far, but in 2019 we saw a gradual diversification of investment from historic pinball machines.
Among the projects that now attract pinball machines, we can count Somnium Space, Gods Unchained, CryptoVoxels but also Blockchain Cuties and CryptoSpaceCommander, for volumes often close to $100,000 per project.

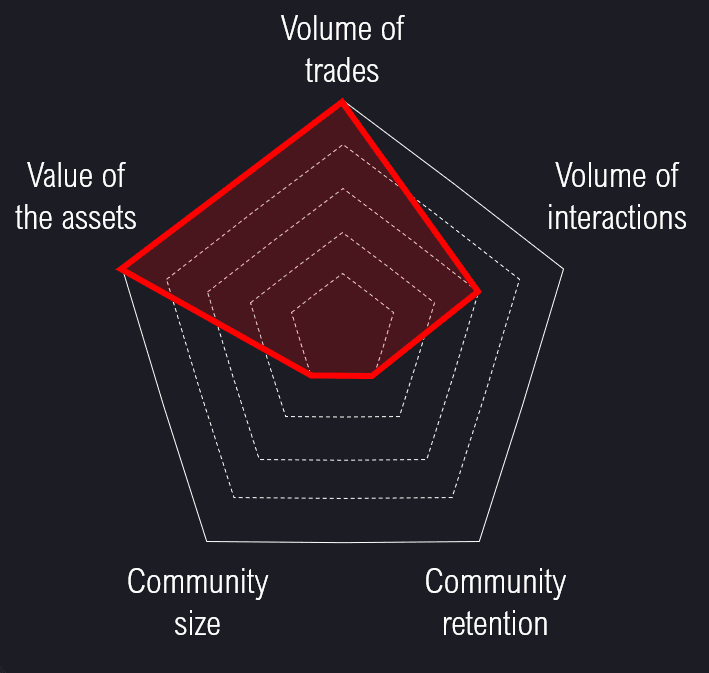
Observation #7 – Champions of Engagement vs. Market Champions
Two main typologies emerged from the NFT IDs:
- Engagement Champions
- Market Champions
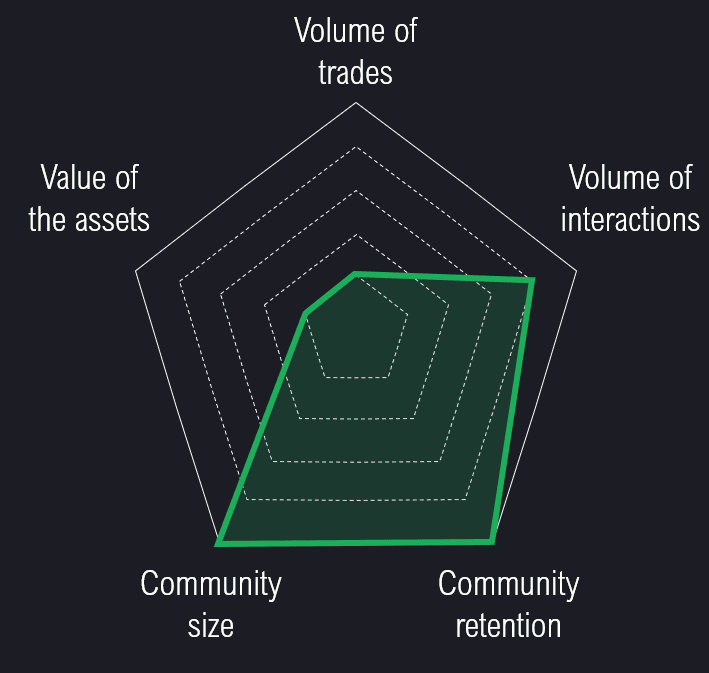
The champions of engagement offer a user experience that is truly attractive to the greatest number, and have already attracted a large volume of players. Their focus is not on the value of assets and the game logic does not encourage speculation, but the use of assets.
Their map essentially expands to the upper left corner.
In contrast, some projects have very active markets backed by high-value assets (more than $100 on average). Having a dense market does not necessarily reflect a rich experience for the end user or even a bright future as a game.
The map of these projects tends to develop towards the lower left corner, sometimes to the detriment of the rest of the map.
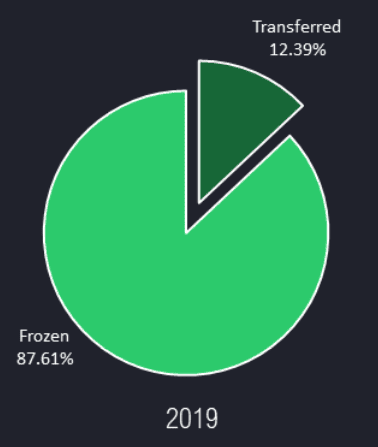
Observation #8 – Almost 90% of the NFTs have not circulated during the past year
Although NFT marketplaces are experiencing considerable growth and undoubtedly play a crucial role in the ecosystem, data collected in 2019 showed that just over 10% of the assets created circulated over the year. It is interesting to note that the rate is identical to that observed over the previous year.
So while the economic dimension of the NFT ecosystem provides an interesting glimpse into the financial health of the industry, it currently only relates to a small portion of its assets.
Observation #9 – NFTs represent a value creation of more than $200M
The Market Cap of the NFT ecosystem, all projects and all assets totaled $210M in 2019, with a Market Cap forecast of $315M.
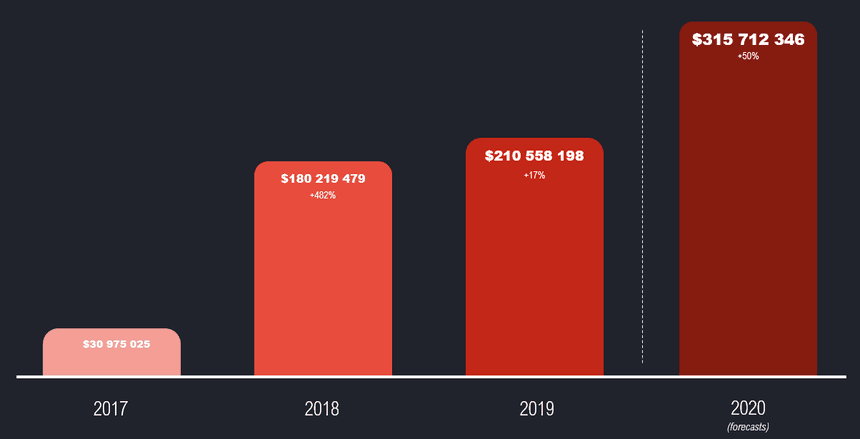
This Market Cap was calculated by multiplying the volume of assets of each project by the average market value of these assets.
This Market Capitalization is interesting to study since it represents a creation of gross value of more than $200MM from scratch in less than two years.
Observation #10 – New KPIs – reflections of a more mature ecosystem
This new edition of the report was the opportunity to publish brand new indicators which allow us to better understand the reality of the ecosystem as a whole but also project by project. Whether it is a snapshot over the year or an evolution month by month or year by year, we will gradually generalize the use of the indicators which seem to us the most relevant, such as:
- Penetration rate
- Isolation Rate
- Liquidity rate
- Trends per category of project
- NFT IDs, based on all the previous metrics