
Who framed the NFT market?
If that was the case the NFT market would be in the middle of a crash, the bubble would have finally exploded leaving behind thousands of ruined users. As proof of the true reality the below figures speak for themselves!
Finally, more specifically, some articles interpret the figures to their own preference..or at least hope to match the popular belief that everything associated with cryptos is a speculative bubble with no future.
When we published an article two months ago saying that there was no NFT market crash, the point was not to challenge and say “so when is it going to happen?”. There is no doubt that with the hype that the ecosystem experienced in recent months,** the euphoria was going to fade eventually.**
While waiting for our 2nd Quarterly report, let’s rise above the noise and look at the overall market trends (beyond the last 2 weeks)
DISCLAIMER:
- 1- to be reactive in the information we produce, the data was extracted on 06.03.2021. The market data for the week from 05.31 to 06.06 represents only half a week!
- 2 – this data relates only to NFT activity on L1 Ethereum
- 3 – for each graph, the linear trend was calculated automatically to give an idea of the average trend for each metric. None of them are bearish over the analysis period.
NFT USD weekly averages
To begin this analysis, let’s first look at some weekly statistics on USD volumes.
NonFungible.com – Average USD volume
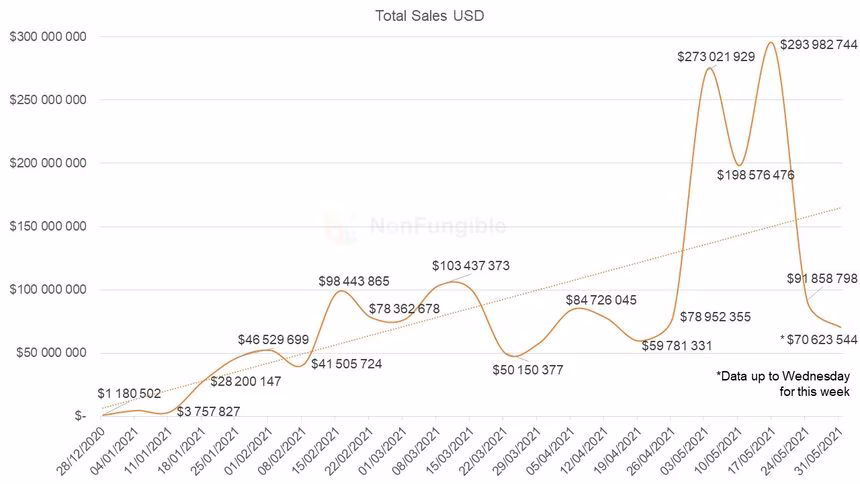
Although the end of 2020 was already marked by an increase in USD volume (as we indicated in our 2020 annual report) it has been 6 months since this time and the overall trend is not weakening.
As of 12/28/2020, NFT’s total weekly sales volume on the Ethereum blockchain was $1,180,502. As of 31/05/2021, counting only three days of the week, this volume was at 70,623,544 dollars.
The reason for the high in May is evidence of over-speculation. A market that goes from $78M to more than $270M in a week is necessarily brought back down. In this case, the descent resulted in a stabilization at a higher level than before at around $90M/week (i.e. 81x the volume in early January).
The descent from a peak does not necessarily mean the explosion of a bubble.
NonFungible.com – Weekly buyers and sellers
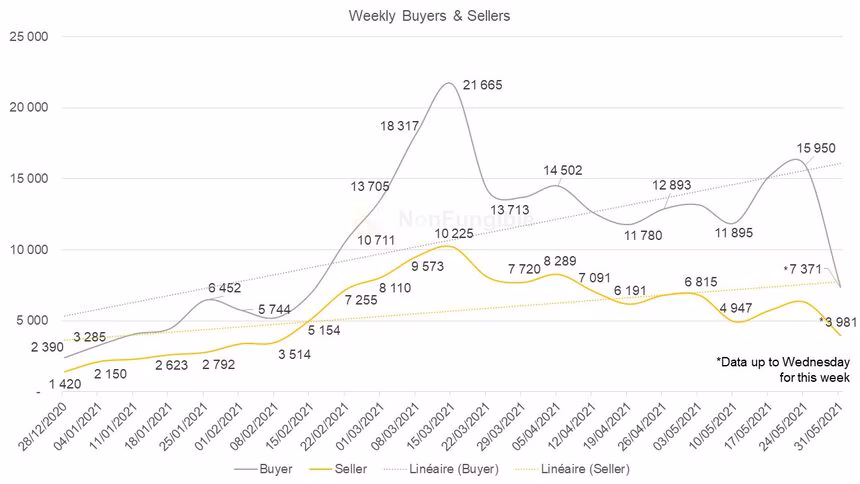
Regarding the decrease in users, here too we must not be mistaken: there were 2390 weekly buyers on 28/12/2020 against 7371 on the first three days of the week of 31/05/2021. This is almost triple since the start of the year!
Another encouraging sign is that the number of buyers is still consistently higher than the number of sellers. This is a crucial indicator to monitor to identify the health of a market.
Similarly on the seller side, the number increased gradually in the first half of 2021 from an average of 1,500 weekly sellers to just over 6,000. The lowest low was reached in mid-May with 4,947 sellers, more than 3x than the number of sellers in January.
The only major decline that can be highlighted on the graph above, is ONLY related to the incomplete data of the last week (Monday to Wednesday).
NonFungible.com – Number of sales
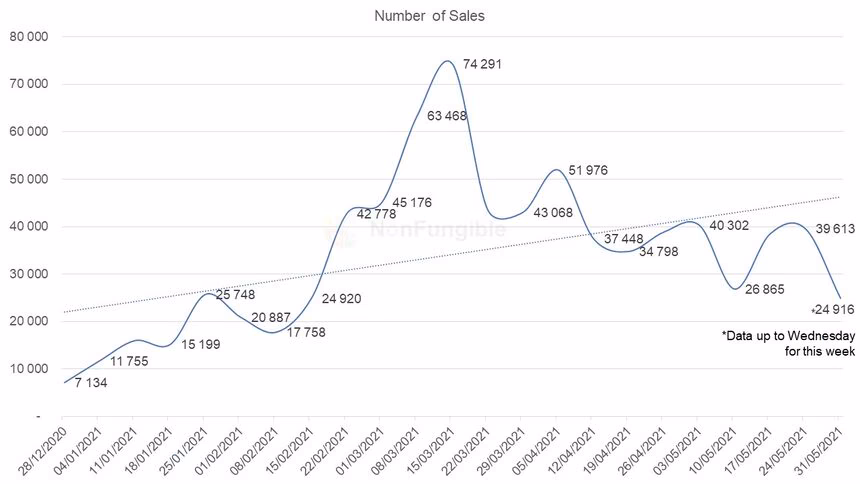
In terms of the number of weekly asset sales, the trend follows the same path: 7134 sales at the beginning of the year, and 24916 at the end of May 2021. Here we see almost triple the sales from the start of the year.
By making a quick average between the number of sales and the number of buyers, we went from 2.9 NFTs purchased per week/per buyer, to 3.3.
It’s hard to contradict the fact that there are more dollars traded, more buyers, more sellers, and each buyer buys more NFTs.
Focus on some projects
To go into a little more detail, let’s take a closer look at the average price of the assets that make up these NFT markets. Have traders fled the markets leaving assets without any value in a zombie market?
NonFungible.com – Average weekly price of most traded NFT
It would seem not.
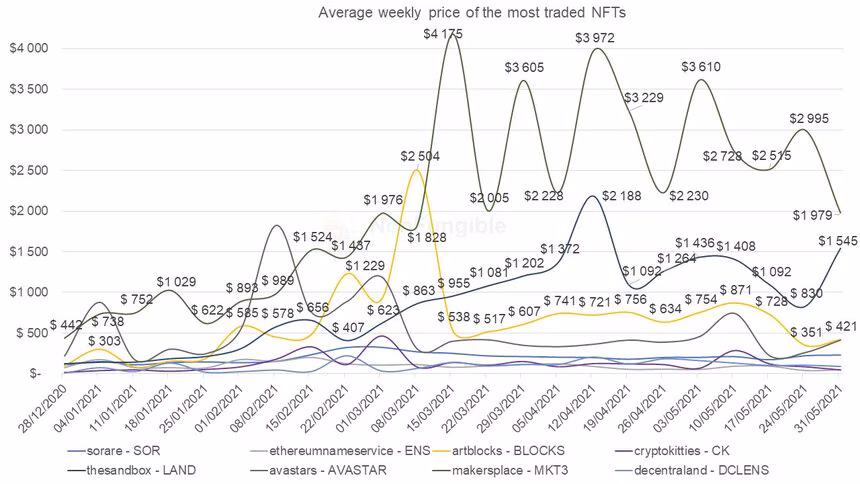
The graph above shows the average asset price of 8 of the major NFT projects present on Ethereum:
Overall, each of these types of assets has seen an increase in value over the past few months and even seem to have held up rather well in the face of the decline in cryptos over recent weeks.
Volatility remains high, but the trend is undoubtedly upwards, regardless of the price range and the typology of the project.
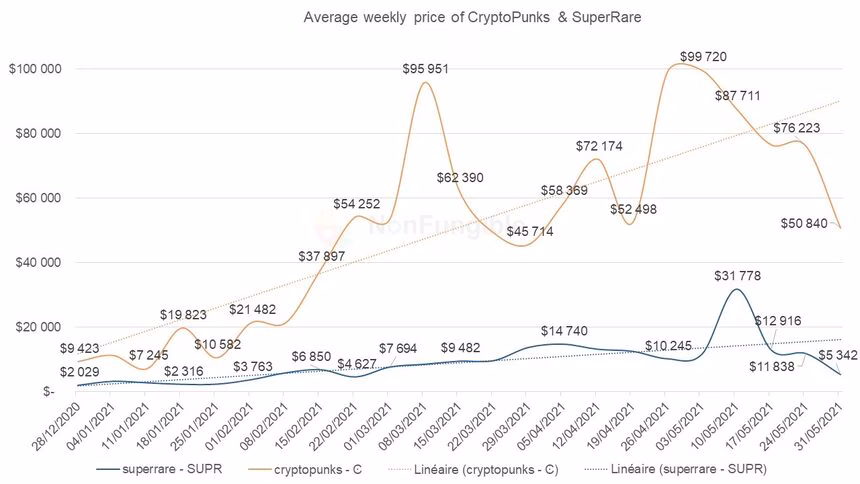
NonFungible.com – Weekly average price of CryptoPunks and SuperRare
On the side of the “star” projects that marked the first half by their volume & price to turn heads (SuperRare and CryptoPunks), the trend is also showing signs of stabilization. We are still a long way from the market collapse that some predict.
It should be noted, however, that the sudden craze for CryptoPunks has given way to a relatively large drop in the average value of these Collectibles, whose price seems to be stabilizing closer to $50,000 than to $100,000.
A little step back
Even if the NFT markets are always interesting to observe under a microscope, it’s sometimes necessary to take a step back to better understand the internal and external factors that can influence a market:
- Its history beyond the last 2 weeks
- in the case of NFT markets, it is essential to analyze in parallel the value of the crypto-currency most used for the acquisition of these assets: Ether
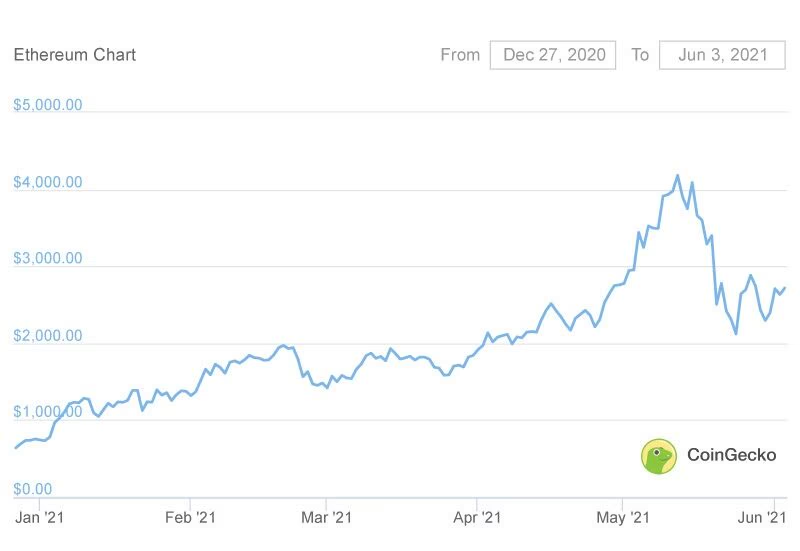
Source : coingecko.com
The rise in the value of Ether over the month of May mechanically led to an increase in the value of all NFTs purchased in Ether. At the same time, the decline observed at the end of May obviously impacted the total volume of USD traded on the NFT markets (see chart “Total Sales USD” above).
However, it is crucial to note that crypto trends have had little or no impact on other indicators of the NFT industry (number of buyers, sellers, even the average price of NFTs seems to make its living regardless of the value of Ether).
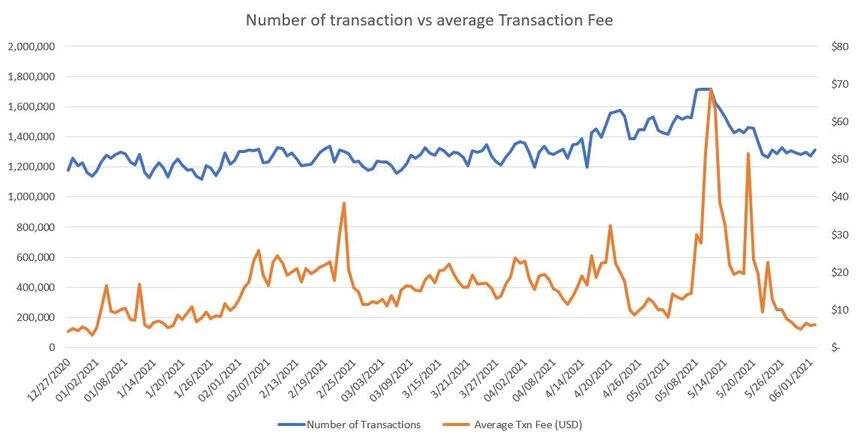
Source : etherscan.io
Another interesting graph to compare is that of the number of daily transactions on the Ethereum network with that of the average price of a transaction.
Despite the high cost of a transaction on the network since the beginning of the year, this has obviously not prevented players, collectors or other buyers from continuing to acquire NFTs!
NFTs are here to stay
One detail that is important to note on the last chart is that of transaction fees on Ethereum. If there is one indicator that has dropped sharply it is this one, to the delight of all Ethereum users (and to the great displeasure of its competitors).
**So we are in a situation today where the only bubble that has exploded is of transaction fees. ** But let’s not sell the bear’s skin before we have skinned it: there are still many improvements to come on this blockchain that will allow us to welcome even more users.
Remember that the trends we have been able to analyze here are found over an extremely short space of time (just a few months). The market trends observed in the first half of 2021 are only a reflection of the general runaway around cryptos and the NFT industry.
While all of these signals are extremely encouraging at the moment, we must not lose sight of the overall trajectory of the NFT industry, from its beginnings at the end of 2017 to today.
Indeed: even if increasingly people want to bury it, the NFT ecosystem is more alive than ever and seems determined to continue its journey for the foreseeable future!