
S1 2020 – NFT Ecosystem Global Performance
Here we are! July is already there!
The first semester of 2020 is over, the time has come to look at the performance of the NFT ecosystem for this first part of the year!
We have decided to compare this first semester 2020 with the same period in 2019, the second semester possibly bringing a bias with the summer and the end of the year irregular activity.
This article is the first of a series of 4 that will be published this month. A new one will be published every Tuesday on our blog. The links are indicated at the end of the article.
Global Performance
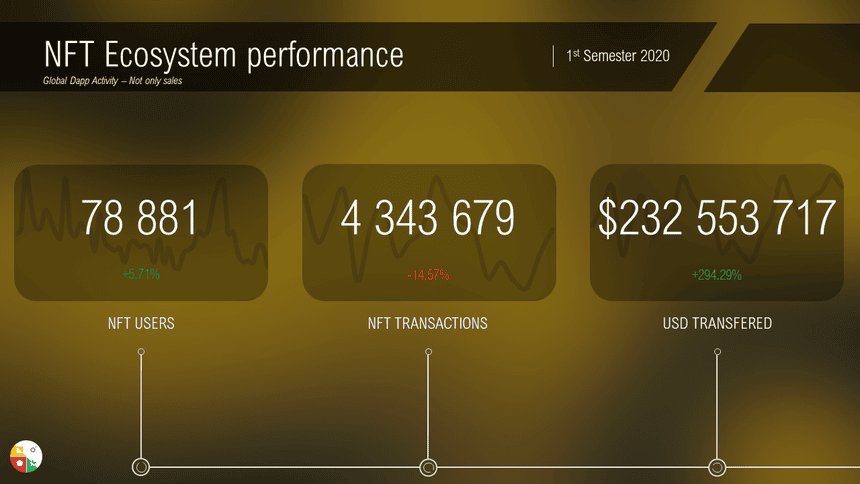
Non-fungible tokens – Global Performance – S1 2020
At first glance, the overall performance over the first half of 2020 is mitigate. There is an overall stabilization in the number of active addresses, almost 78,000 NFT users.
The overall transaction volume over the first 6 months of the year fell by almost 15%, which we put on the account of technological developments and the proliferation of side-chains encouraging “non-essential” transactions to be done off-chain to guarantee a smooth UX.
The volume of dollars exchanged has soared to more than $230 million, for an increase of almost 300% compared to S1 2019. We believe that the pre-sales (especially those of The Sandbox), the introduction of new assets on marketplaces and the gradual development of the Art Blockchain market are important vectors of this growth.
Transactions Volume Performance
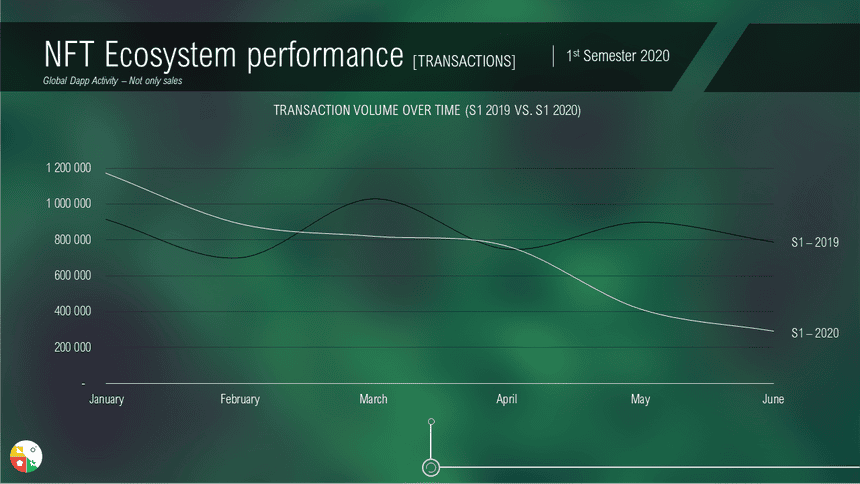
NFT Market Performance – Transactions Volume – 1st Semester 2020 VS. 1s Semester 2019
The difference in volume between S1 2019 and 2020 can mainly be seen on the relative peak in March 2019 and the fairly significant drop in May / June 2020.
USD Transfered Performance
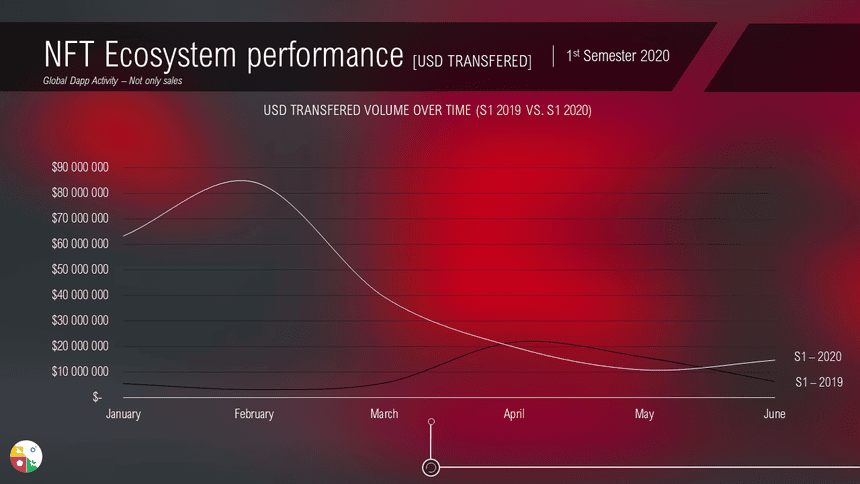
NFT Market Performance – USD Transfered – 1st Semester 2020 VS. 1s Semester 2019
The USD Transfered Volume in January and February 2020 widened the gap with the previous year. With a peak at more than $85 million traded in February (mainly from the primary market), we observe that the overall trend goes back down in April 2020 to fall below the monthly volumes traded in 2019.
Active Addresses Performance
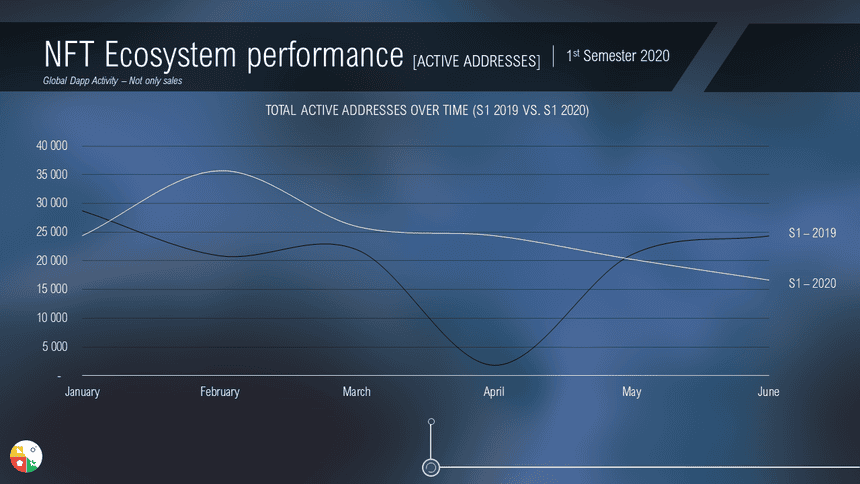
NFT Market Performance – Active Addresses – 1st Semester 2020 VS. 1s Semester 2019
The average curve of active wallets in S1 2020 seems to show that NFT users are generally more active. Even if the total volume of active addresses over the period has not changed much (around 75,000 addresses), there are 15,000 more active addresses in February, 5,000 more in March and just over 20,000 on April.