Analysis
S1 2020 – Virtual Real Estate
The fourth and final analysis on the first half of 2020 markets and dapp statistics. This time, in the Virtual Real Estate or Metaverse segments.

The fourth and last article in our series of analysis on the first half of 2020 offers you a concentrate of insights on the Virtual Real Estate segment, a segment that has historically driven the growth of NFTs with the first $LAND Auction of Decentraland in late 2017.
A particular focus will be given to the evolution of the Decentraland market, with the arrival of the new asset classes: Wearables and Names.
Virtual Real Estate Market Trends
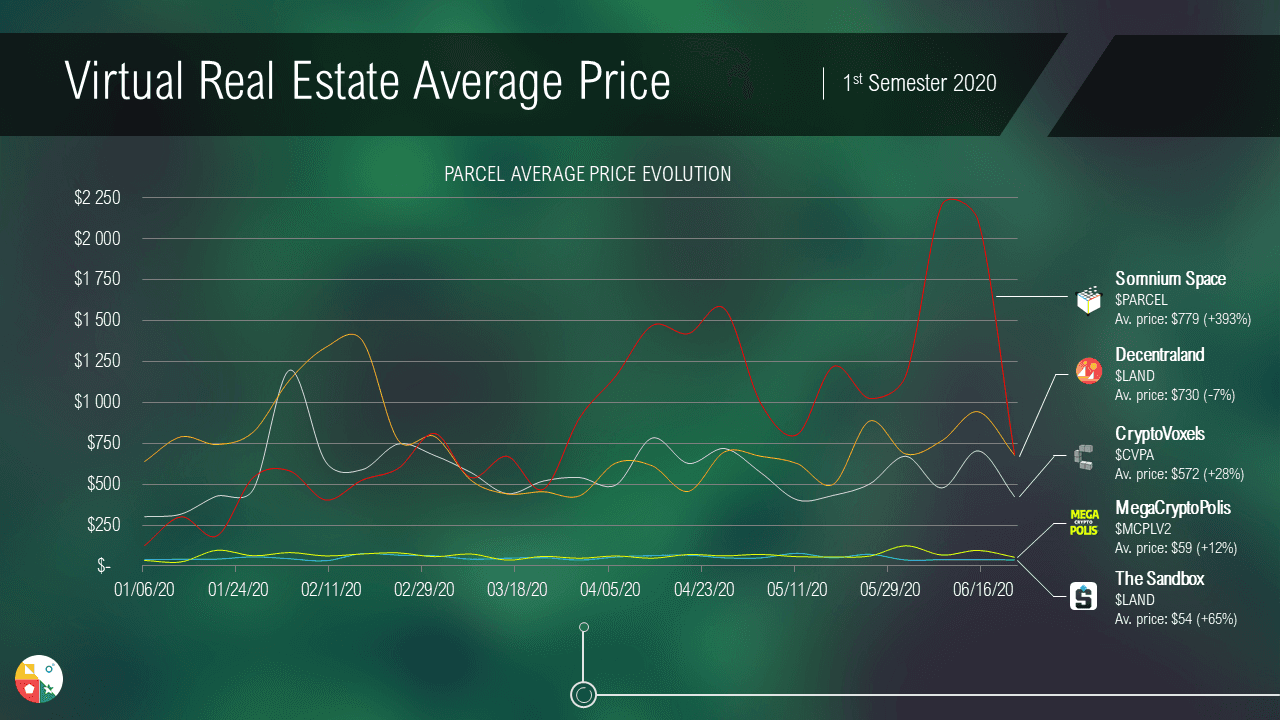
Somnium Space offers the greatest latitude in terms of price differences, from less than $200 to more than $1,500 in certain weeks of April. This increase in price over the period is enough to take first place at Decentraland on the average price of plots.
Decentraland experienced a slight drop with an average price of $LAND which remains above the $700 mark.
The Sandbox and MegaCryptoPolis stabilize with average prices per plot around $50 but we still observe a relative increase in the average price of all plots.
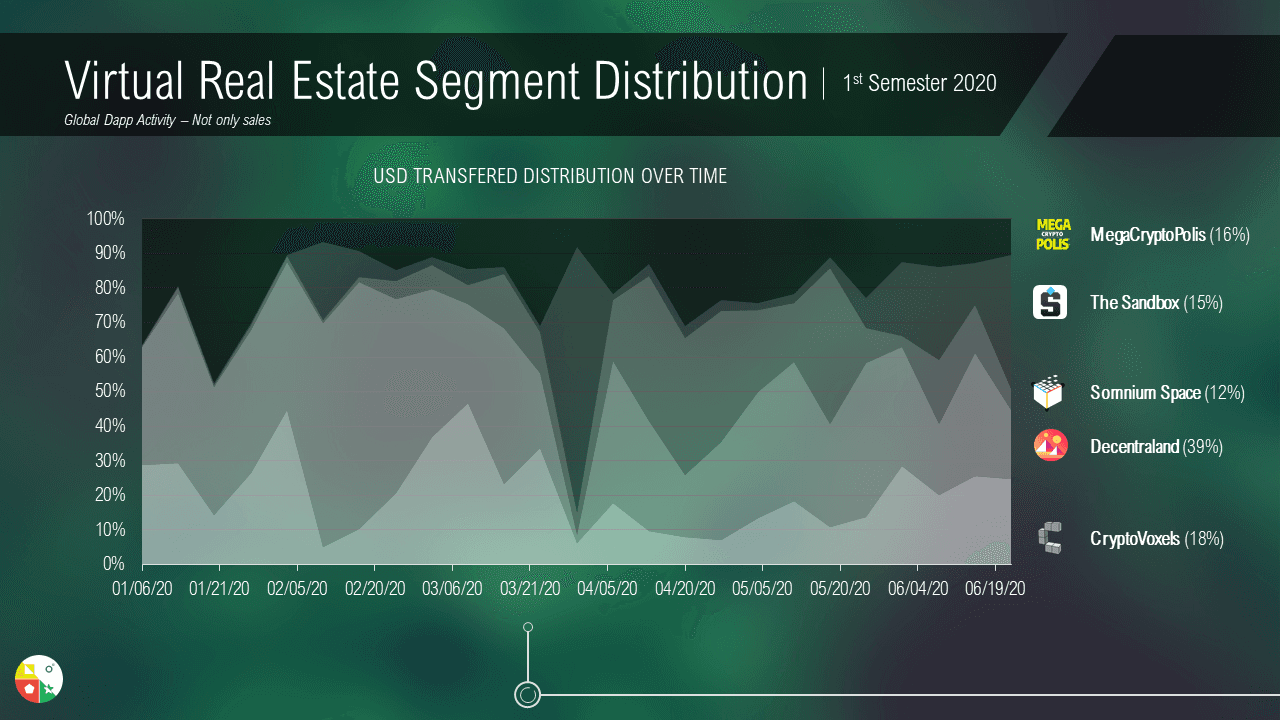
The distribution of the market from the point of view of the transferred USD leaves the share to the historic project: Decentraland, with 40% market share.
Note the important place occupied by the latest project arrived in the sector: The Sandbox, whose 14% market share is mainly due to the successful presale LAND at the end of March.
Focus on Decentraland Market Trends
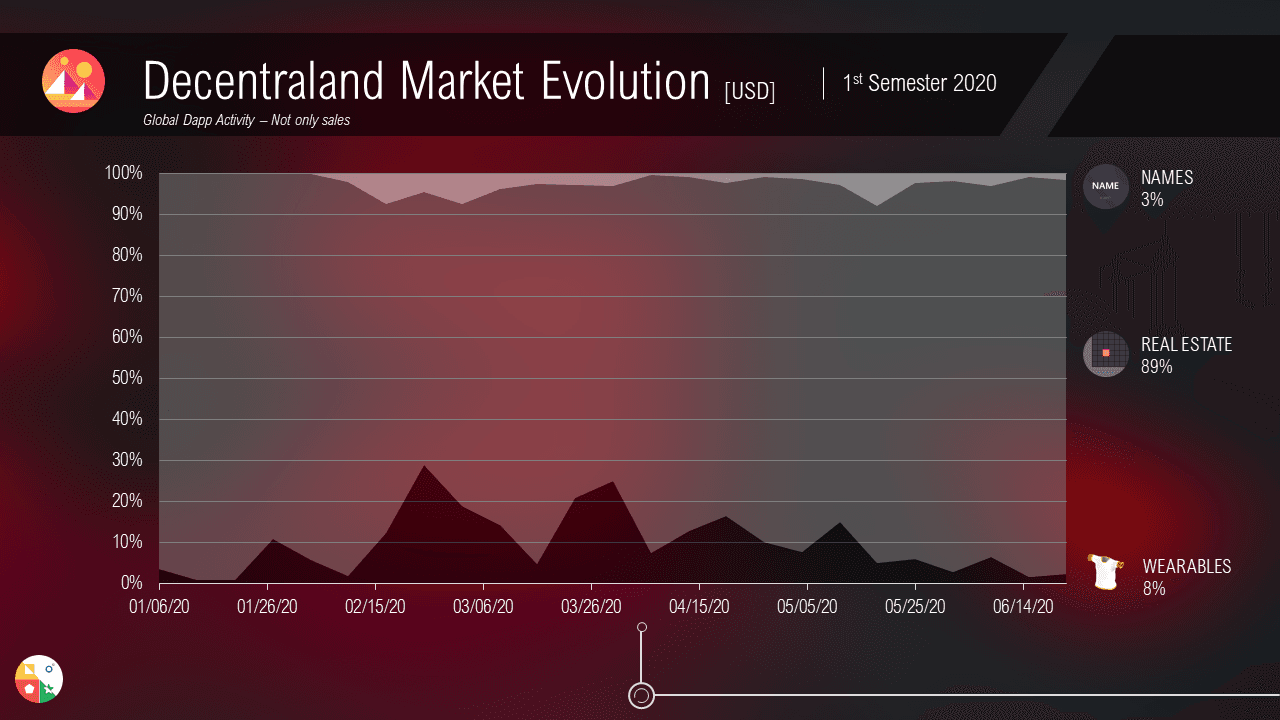
The Decentraland market remains predominantly supported by the secondary market of $LAND and $ESTATES, which still represent 88% of the market from the point of view of the USD. The $WEARABLES represent only 9% of the volume and the $NAME 3%.
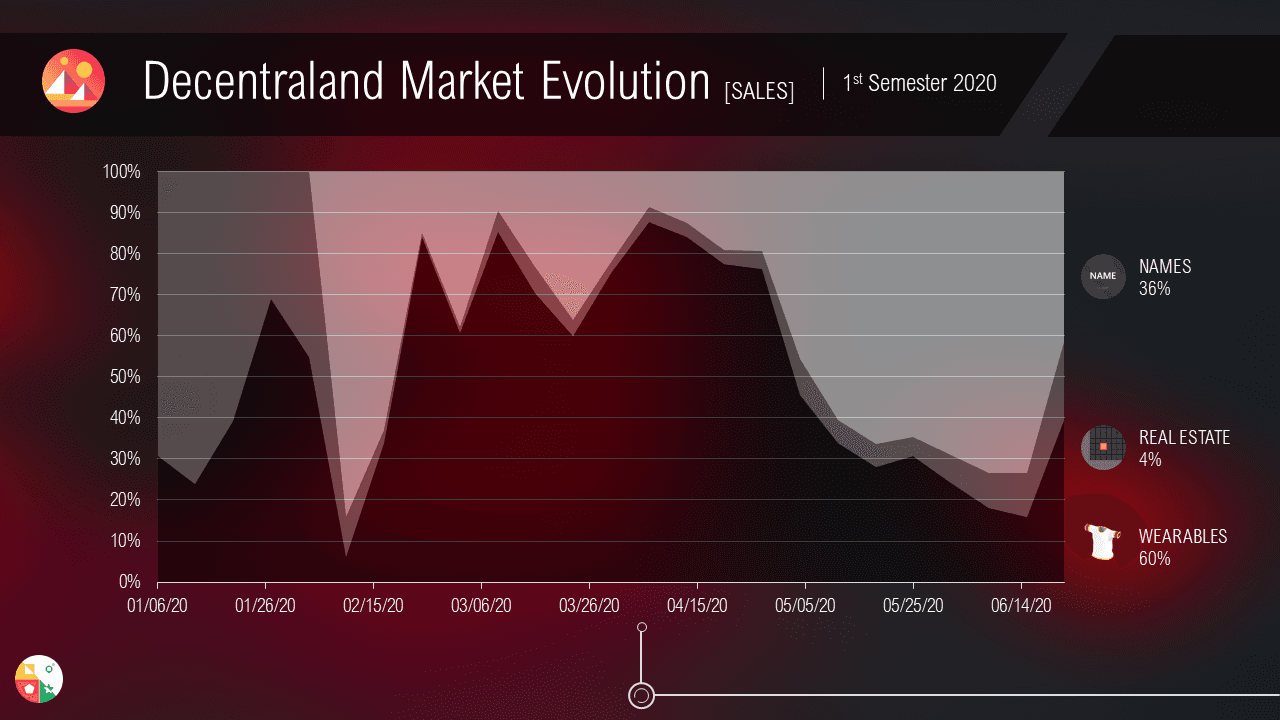
If we look at the Decentraland market in terms of the number of sales, the arrival of $NAME on the market fundamentally changed the morphology of the market. These reduced value assets represent a very large share of the market in terms of sales quantity.
The high price and scarcity of $LAND explains this difference between the 88% of USD Transferred and only 5% of the volume of Sales.
Despite a predominance of $WEARABLES in the middle of the period, we observe a progressive slowdown of this type of asset in favor of $NAME.
The other analysis on the First Semester 2020
Global NFT Industry Performance vs. First Semester 2019 (Transactions, USD, Active Addresses)
Focus on Art, Domain Names & Trading Card Games (Distribution per project on each segment)