Tips and Tricks about NonFungible.com
Summary
- Which project assets are worth the most?
- How has the average price of a LAND evolved?
- Has my LVL 10 Hero of MyCryptoHeroes gained or lost value?
- Identify flippers and whales
- Calculate the income generated by a flipper
- What is the most expensive Axie creature of all time?
- How to distinguish secondary market from primary market sales (Player to player vs. Project to player)
- I just found some interesting sales, how to share my discovery with other people?
- Where to find an overview about the NFT space?
- I am very intrigued by this “Brownies” colored, “Cyan” eye colored, and “Fox” bodied CryptoKitties! But the price on the marketplace seems a bit expensive … How do I find the right price?
- I want to sell my Decentraland LAND at coordinates 59, -109. How can I determine an accurate price?
Which NFT project assets are worth the most?
I’m just discovering the NFT ecosystem, and I’ve heard that some projects have assets that are worth more than others. Ok … how to identify the project where the assets have the most value?
1 – From the home page click on “Market Tracker“
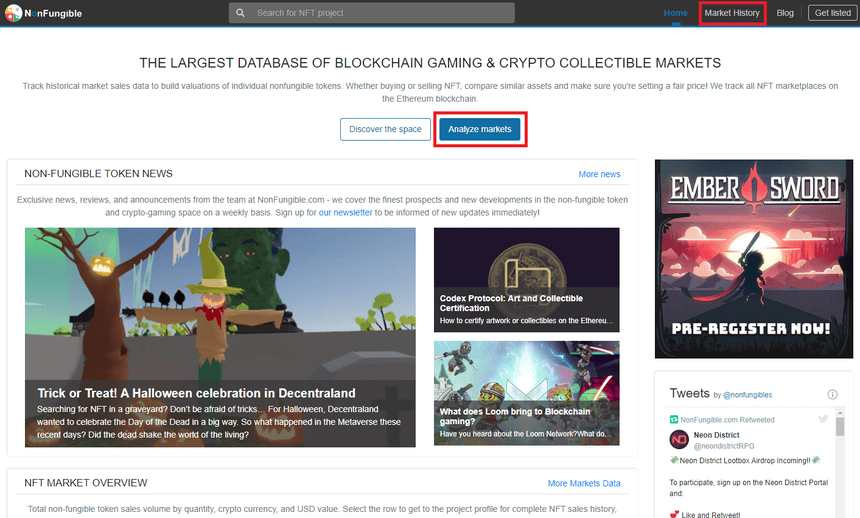
2 – Once on the “Market” page, rank the projects by “Average price 7d (USD)“. One click ranks them from the cheapest to the most expensive. A second click classifies them from the most expensive to the least expensive.
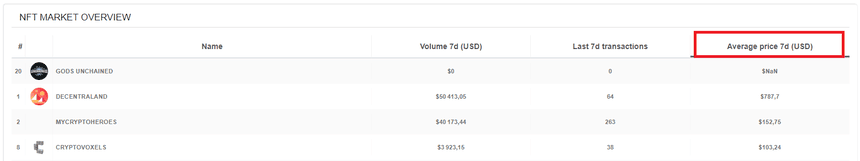
3 – the project with the most expensive assets so far is Decentraland with an average price of $787, far ahead of all the others!
Ok! But how has this price evolved?
Indeed the trend displayed on the “Market” homepage is based on the last 7 days. To know if the trend is rising or falling:
1 – Click on the project in the list

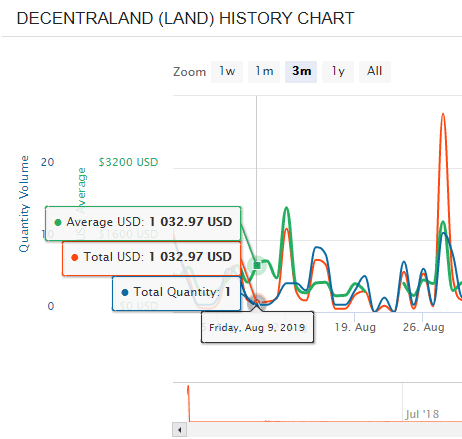
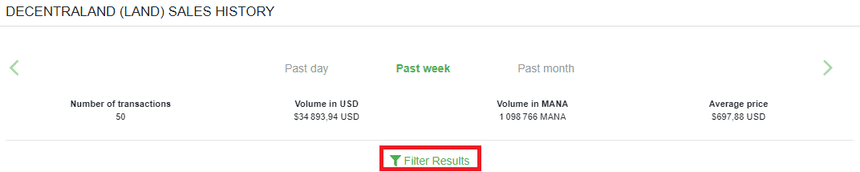
2 – Go to the bottom of the project page and analyze the following graph:
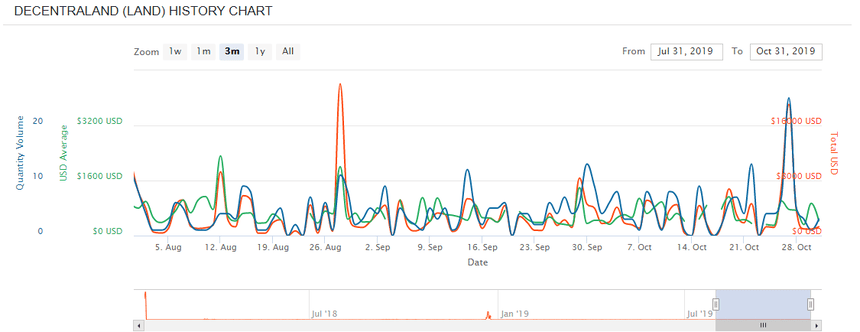
3 – The green curve indicates the evolution of the average LAND value over time. Although the curve is sawtooth, we can note that the trend is globally going down over the period.
Has my LVL 10 Hero of MyCryptoHeroes gained or lost value?
I won a hero in MyCryptoHeroes several months ago, it just reached level 10 and I would like to know its value today.
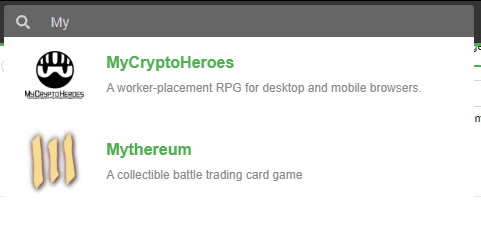
1 – Search for “MyCryptoHeroes” in the search bar
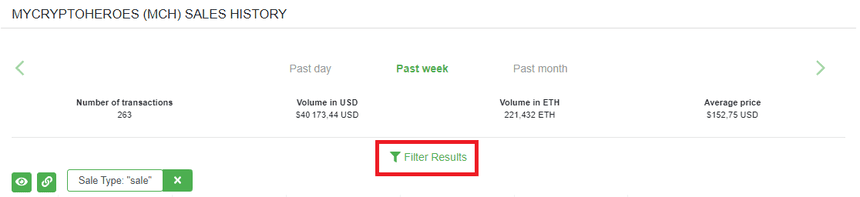
2 – Once on the project page, click on “Filter Results“
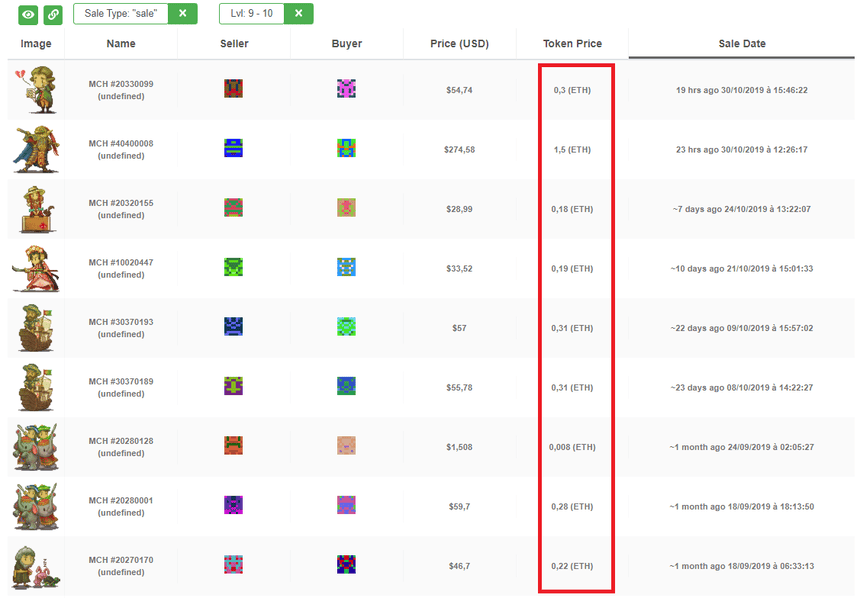
3- Filter sales on level 9 and 10 heroes then click on “Apply“
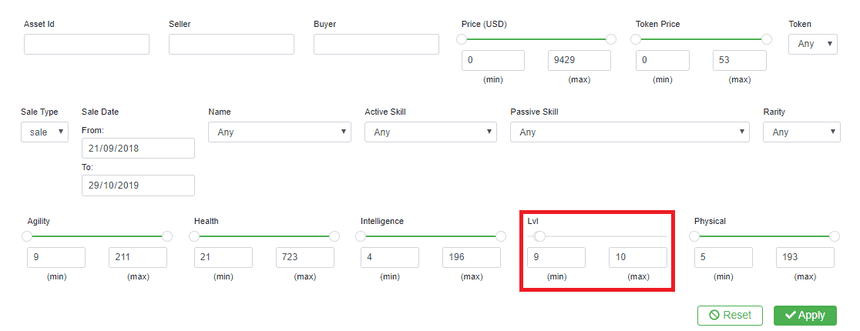
4- A LVL 9 or 10 hero seems to sell between 0.2 and 0.3 ETH on the market lately
Identify flippers and whales
Arriving on Decentraland’s market page, I notice that one address has sold several expensive assets in recent days. Is it just a coincidence or an active flipper?
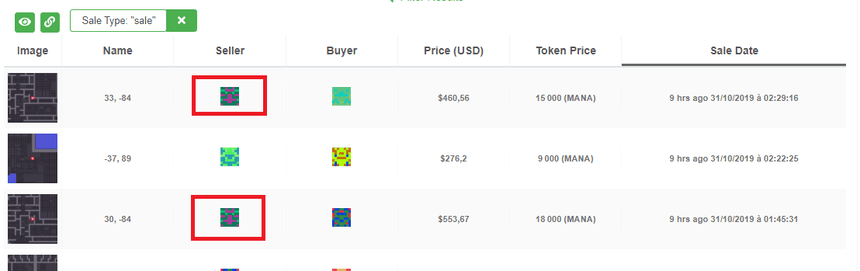
1 – Click on the details of the sale and locate the address of the seller
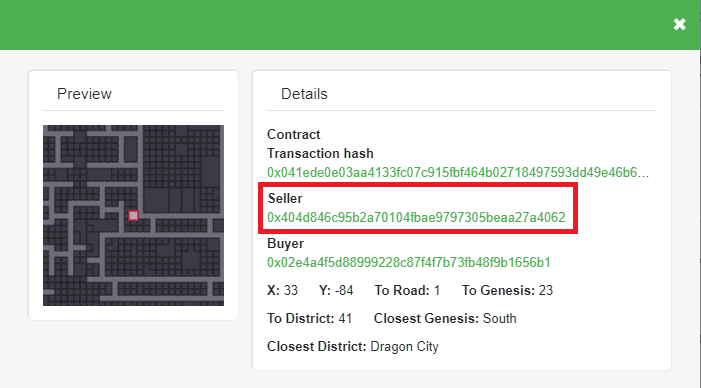
2 – Copy the address of the seller then close the pop-in
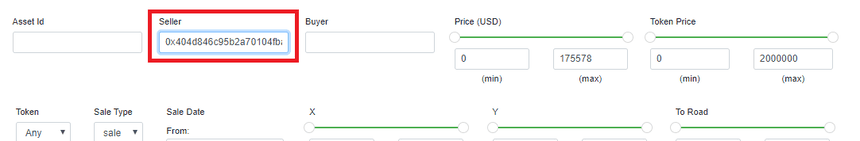
3 – Click on “Filter results“
4 – Paste the address into the “Seller” field of the search filters and then “Apply“
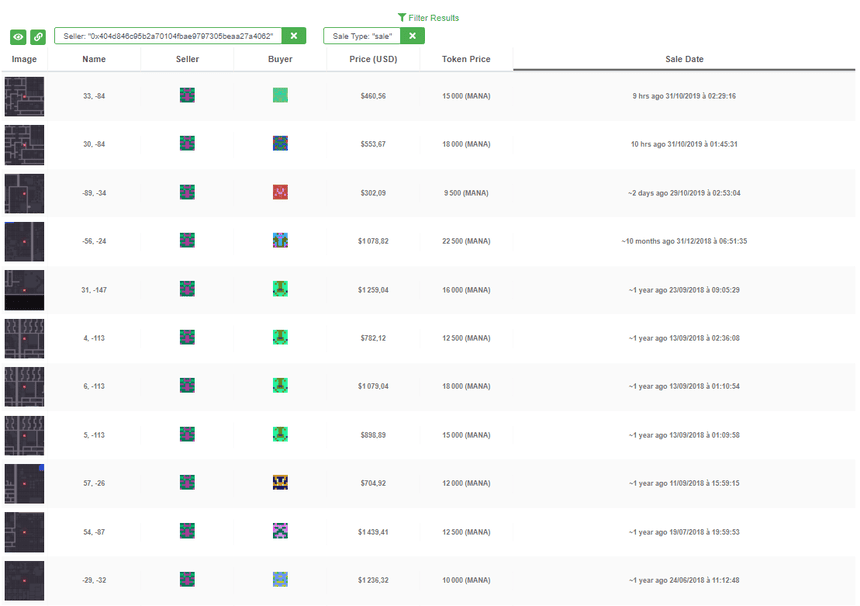
5 – This wallet has only sold 11 LAND since the opening of the Marketplace, it is likely not the biggest flipper in town. We can, however, notice that he has resold most of these LANDs for over $1,000!
Calculate the income generated by a flipper
I have in front of me the list of all the sales of a specific Wallet address (cf 4), so I know the turnover he generated by selling these 11 LANDs. But did he make any money on these sales, and if so, how much?
1 – On the list of these sales, we can see that it has generated 161,000 MANA.
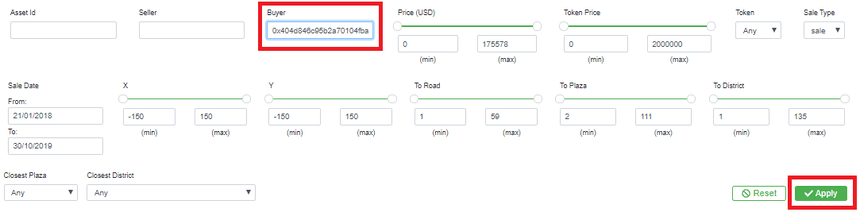
2 – Delete the search field “Seller” and copy the address ETH in “Buyer” to identify the list of assets purchased, then click on “Apply“
3 – This address bought 12 LAND, for a total of 122,563 MANA
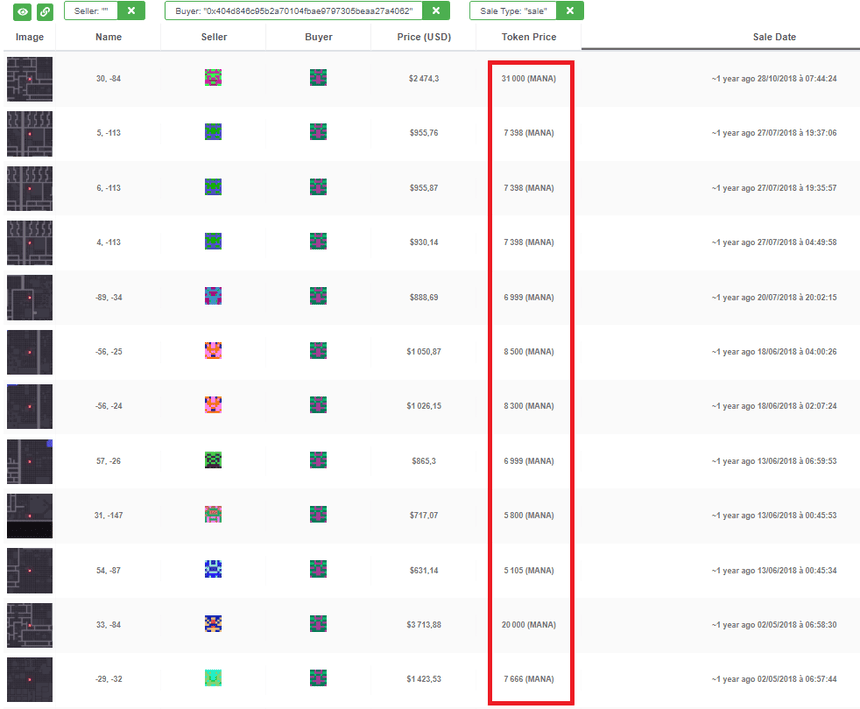
4 – [161,000 – 122,563 = 38,437 MANA] This address has resulted in a profit of 38,437 MANA on the resale of his LANDs.
What is the most expensive Axie creature of all time?
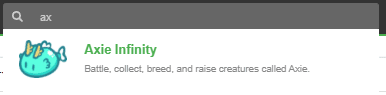
1 – Look for “Axie Infinity” on the search bar
2 – Sort by “Price USD”. A click rank from the cheapest to the most expensive, a second click class from the most to the least expensive.

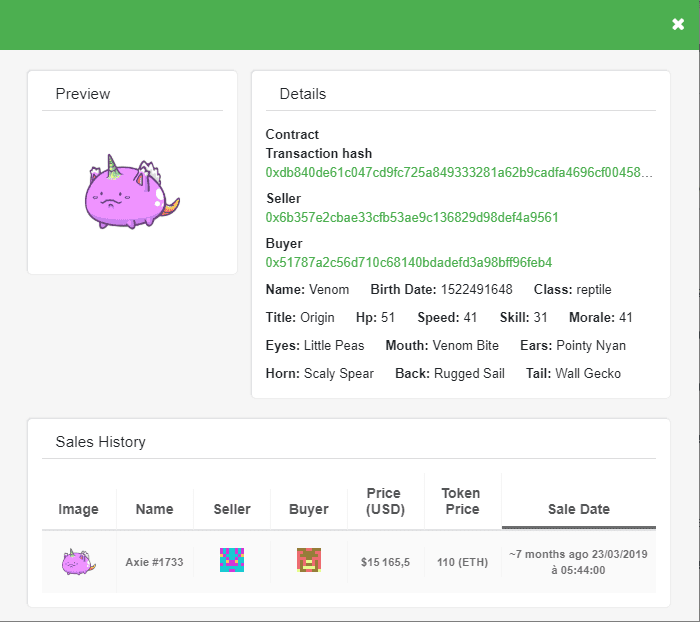
3 – The most expensive Axie of all time has been sold in March 2019 for 110 ETH, or $15,165

4 – By clicking on the row, we can see all the characteristics of this Axie
How to distinguish secondary market from primary market sales (Player to player vs. Project to player)
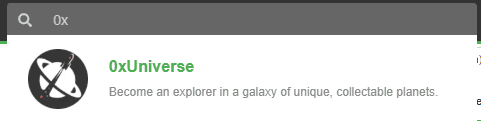
1 – Go to the project that interests you, here we will do the test with 0xUniverse. Search for the name of your project in the search bar
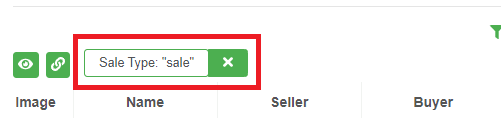
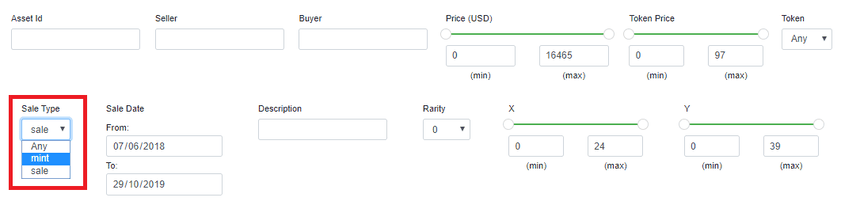
2 – Once on the project page you notice that a filter is already applied by default “Sale Type: “sale”“. This means that only sales between players are displayed by default.
3 – To display the assets sold directly by the project (Primary Market) just click on “Filter Results” then change “Sale Type” by passing it on “Mint“, then click on “Apply“
4 – The sales now displayed are typically only those of the primary market (Project > Players).
I just found some interesting sales, how to share my discovery?
1 – Whichever market page you are on, you always have the option to share the exact URL of the page with others. This URL contains the search parameters that you applied, the columns you chose to show or hide, and any sorts.
2 – Apply your filters via the “Filter Results” button
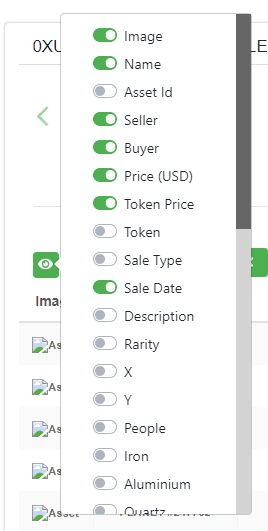
3 – Choose the columns you want to show or hide using the “Columns” button
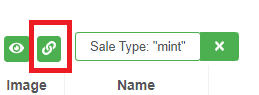
4 – Click on the “URL” icon next to it, the page refreshes and the URL now contains all the parameters of your search:

Where to find a overview of information about the NFT space?
1 – Keep watch on new projects, follow ads, developments, and NFT markets requires a lot of time each day! Where can I find a digest of news and NFT markets?
2 – The NonFungible.com team publishes a newsletter every Tuesday bringing together all the information on the NFT ecosystem:
- An exclusive article about statistical analysis, project review, or trend analysis
- Curation of the most important news of the week
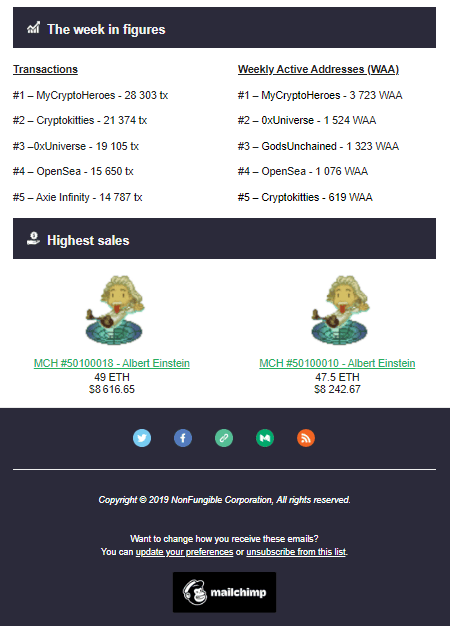
- Condensed performance of NFT markets
- Highest sales of the week
3- This newsletter is 100% free, you only have to register on the bottom of our homepage.
How to find the right CryptoKitties price?
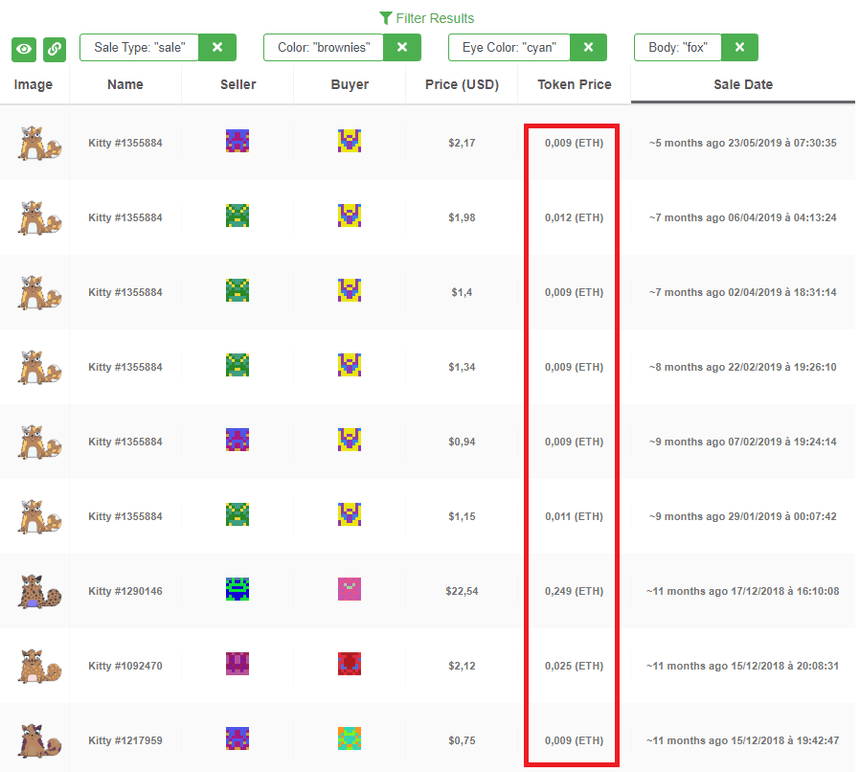
“I am very intrigued by this “Brownies” colored, “Cyan” eye colored, and “Fox” bodied CryptoKitty! But the price on the marketplace seems a bit expensive…“
NFT markets remain extremely speculative, it is often complicated to know what is the “fair” price of a collectible.
Before buying an asset on an NFT marketplace, we recommend you take a look at the latest sales of comparable assets to give you an idea of the average price.
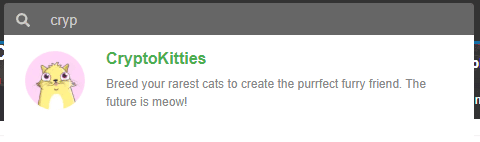
1 – Go to the page of the project that interests you, here “CryptoKitties“, from the search bar
2 – The Kitty that interests me is “Brownies” colored, “Cyan” eye-colored and the “Fox” bodied. All I need to do is fill in these criteria in “Filter Results” and validate by clicking on “Apply”
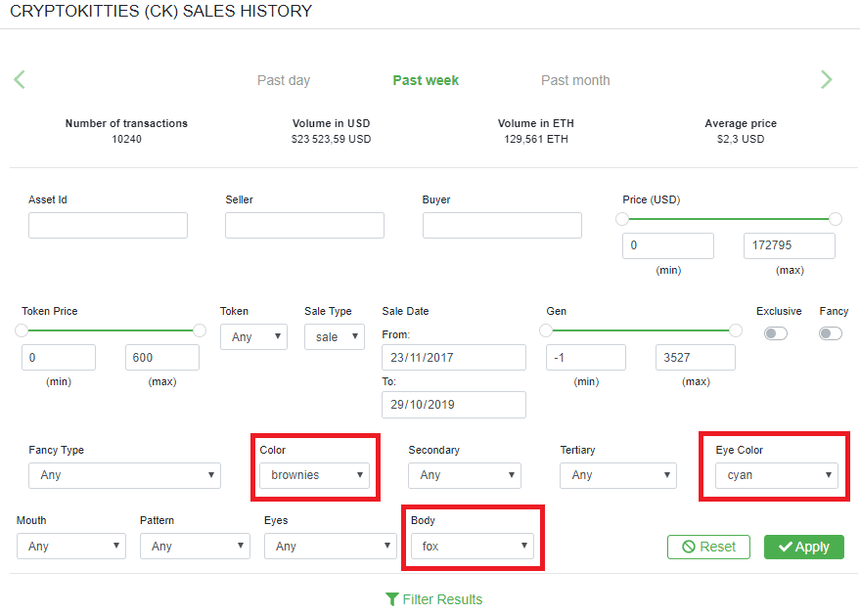
3 – It appears that the average price of a CryptoKitties is about 0.010 ETH. It will still be necessary to check the precise Cattributes of the Kitties which have sold more expensive, to check that they do not have a complementary “Cattribute” which makes them more rare
I want to sell my Decentraland LAND
How to sell at the right price?
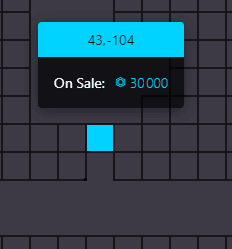
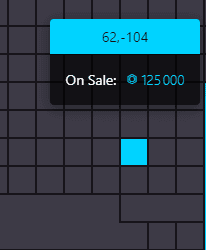
In Decentraland’s official marketplace, many LANDs are on sale near my plot, but the prices are quite varying, I do not know at what price to list my parcel to sell at the “fair” price. Below, two parcels near my LAND (both non-roadside) are listed at 30,000 and 125,000 MANA.
1 – To have a consistent information on the price of parcels in this area of the map of Decentraland, I will have to find sales of parcels comparable to mine, namely
- non-roadside (this feature greatly impacts the price of a LAND)
- located between 20, -99 and 70, -110 (the situation on the map determines the price)
- over the last 3 months (prices change over time)
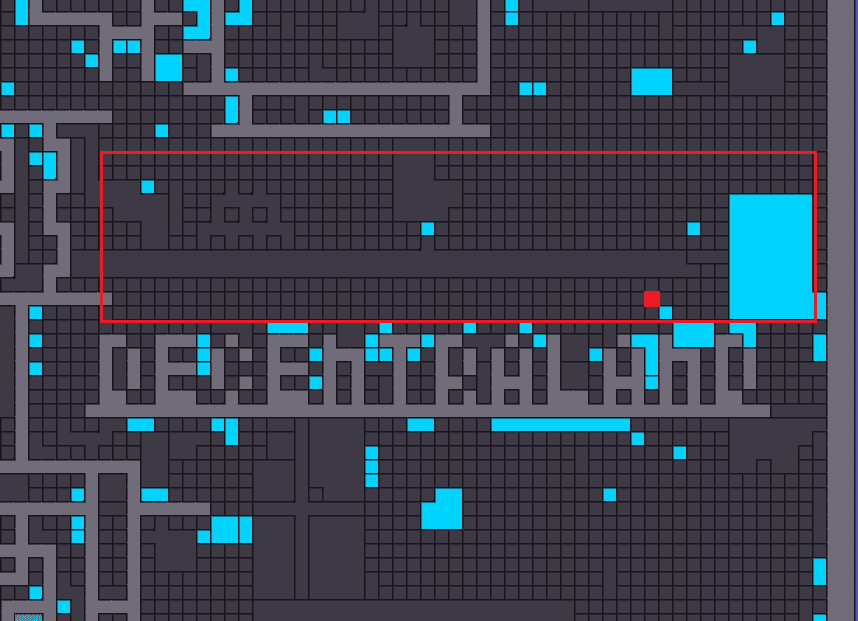
(The area on the map of Decentraland on which to focus our research)
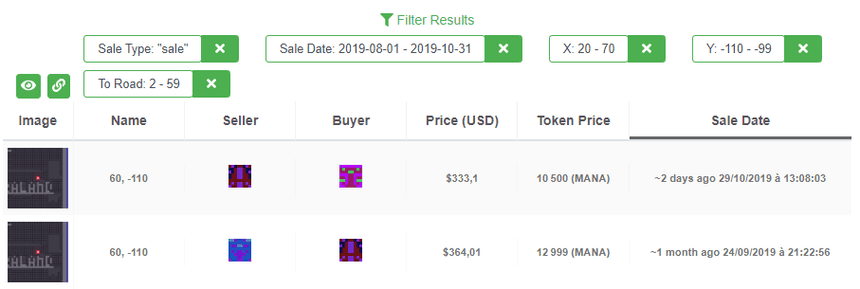
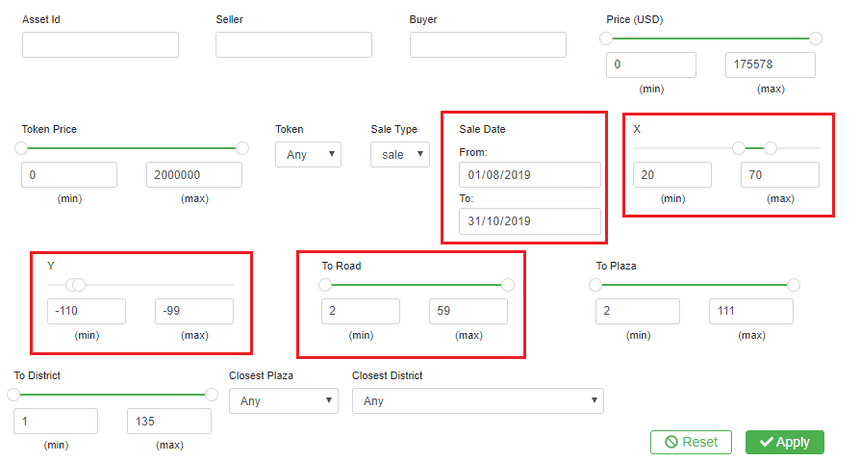
2- from the Decentraland page on NonFungible, I apply the criteria listed above in “Filter Results”
- X: between 20 and 70
- Y: between -110 and -99
- To Road: between 2 and 59 (1 = Roadside)
- Sale Date: between 01/08/2019 and 31/10/2019
3 – Only two sales took place in the area during the period. This is the same plot, which was sold cheaper than it was purchased. We can conclude that 10 500 MANA seems to be a suitable price for a parcel in this area of the map.