
What does the NFT Ecosystem look like after the Boom?
Although the NFT adventure on Ethereum officially began in 2017 with Cryptopunks, the first “early adopters” of blockchain gaming and CryptoKitties appeared after the crash of the crypto market in early 2018.
At that time, the atmosphere was quite gloomy in the crypto space but it was also the moment when we could see the creation of a first generation of proactive users in the development of the projects that interested them.
After a rather intense FUD phase a few weeks ago, last week we published a global analysis to respond to this and tried to sooth the spirits at the same time. Today we looked at other key indicators to better understand the current state of the market:
- The evolution of the number of active wallets from September 2020 to June 2021.
- Sales volume (number, total USD volume, and average sales price).
- Number of buyers and sellers.
- Sales price range.
The results are more mixed than a simple “NFTs are dead” or “everyone uses them“, let’s look at the numbers in more detail and try to interpret them in the most objective way possible.
So what has the impact been of this “NFT Boom” on the ecosystem? Did people who were attracted by the hype stay or leave as quickly as they came? Does the Post-Boom look like the pre-Boom?
Evolution of active wallets
To determine the evolution of active wallets over time, we looked at whether they had completed at least one NFT transaction over several periods of time:
- Before: from September to December 2020
- Pre-Boom: January to February 2021
- Boom: March to April 2021
- Post-Boom: from May to the first week of June 2021
[DISCLAIMER] The chart below shows the wallets that have been active ONLY over the period indicated. The total volume of active wallets in each of the periods is higher.
The objective here is to realize the rate of people who were interested in NFTs at some point but did not continue to be active afterwards.
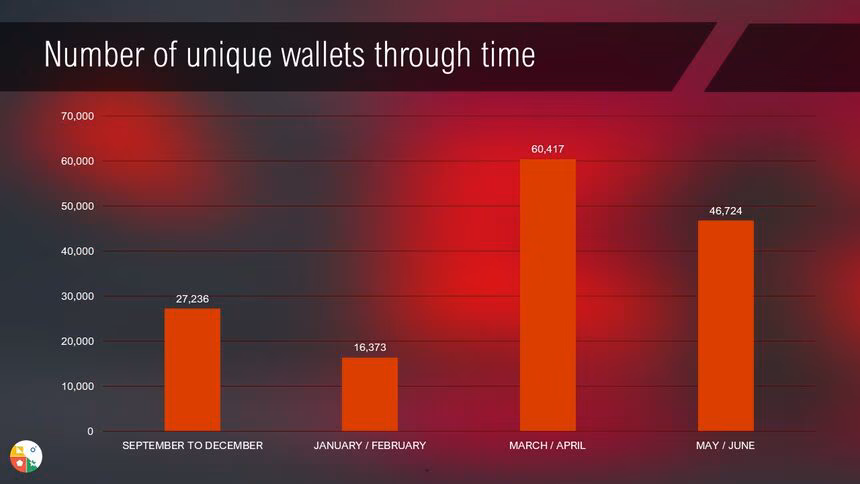
Before the Boom
While 27,236 addresses were active during the period September to December 2020, 16,373 (-39.8%) addresses that were not active before this appeared for the period of January / February 2021.
**The Boom **
The Boom has seen more than 60,000 new wallets interact with NFTs. This is a lot in proportion to the size of the NFT ecosystem, but relatively little when you think of all the hype that has occurred around the world.
Note that these 60,417 wallets arrived during the peak of media coverage have not (for the moment) followed up or interacted with an NFT since.
After the Boom
Where some claim that the “Boom” is over, and that the market has collapsed, we observe here that during this period May / June, more than 45,000 new wallets interacted for the first time with the NFTs. This score is much higher than the Pre-Boom periods.
So far, these figures point to the evidence that there has been a very sharp increase in the number of new addresses active in the NFT ecosystem. This is due in part to the record sale of Beeple as well as the global media coverage of NFTs, bringing a wave of new users into the ecosystem.
Remember that studied here are only the new addresses active on only one of the periods analyzed (Before / Pre-Boom / Boom / Post Boom).
Only passing through?
The question then arises whether it was just fashionable to participate or whether the users who arrived during or shortly before the Boom stayed on afterwards. In other words: what is the retention rate of the NFT ecosystem regarding these new users?
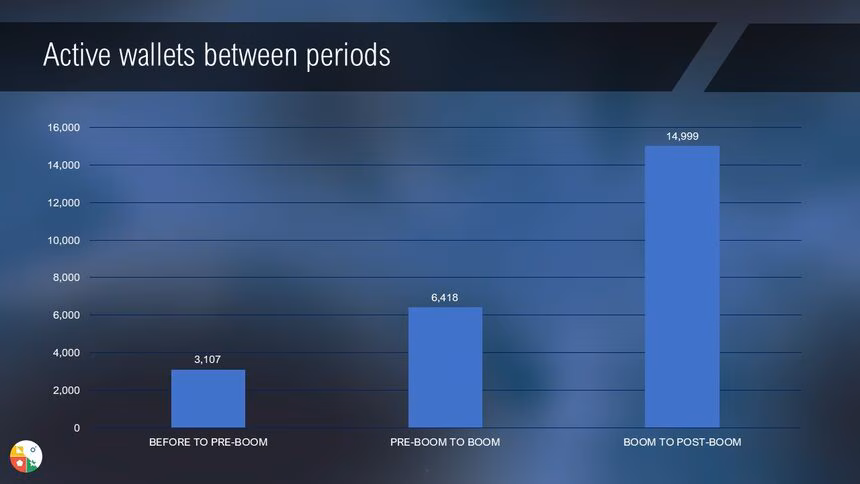
While the active wallets between the “before” period (from September to December 2020) and “Pre-Boom” (January to February 2021) numbered 3,107, there were 6,418 active over the two consecutive periods “Pre-Boom” and “Boom” (March to April 2021) an increase of 106.5%.
This indicates a good proportion of new users who became interested in NFTs at the very beginning of the 2021 hype then remained active over the following months.
In contrast to the previous downward trend, the number of active wallets over the “Boom” period to “Post-Boom” saw an increase of 133.7%!
If we compare this trend to the 60,000 new wallets active only during the Boom, here we have nearly 15,000 wallets arriving during the Boom phase that continued to be active over the following months.
Taking into account these two populations (60k + 15k) we arrive at a total of 75,000 new wallets that arrived during the Boom, of which 25% then remained active afterwards.
We can conclude here that the ecosystem has presented a retention rate of 25% new users.
Distribution of NFT sales
Another important indicator is that of the distribution of NFTs sales. In concrete terms, the question is how have price trends been impacted by the Boom?
We have defined price ranges between $0.1 and $10 up to an interval between $500,000 and $1,000,000.
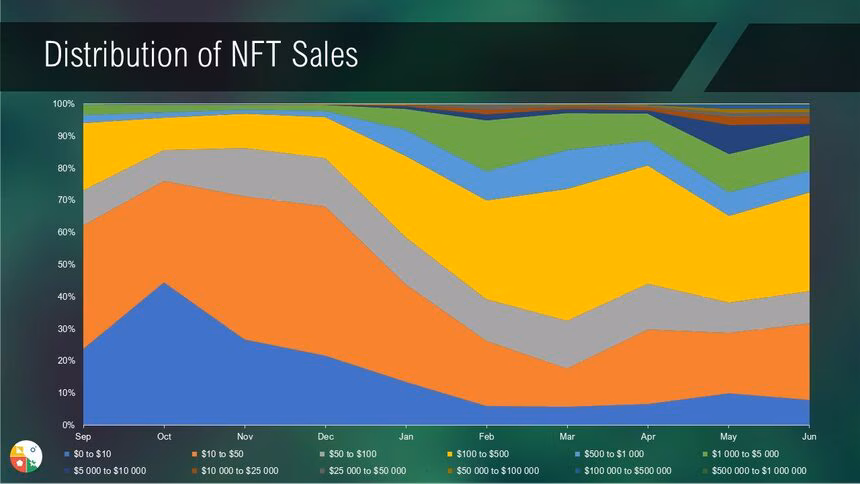
On this graph, one element is particularly important to remember: at the end of 2020, 99% of NFTs sold were sold for less than $5,000. It is since the start of 2021 that assets that sold for more than $5,000 have gradually taken their place at the expense of NFTs sold at less than $10.
This could have been explained by particularly high transaction fees (buyers not wanting NFTs worth less than the price of the transaction) except that in recent weeks, the price of gas has dropped dramatically and the proportion of the cheapest NFTs have not risen.
The NFT market landscape has not changed dramatically between September 2020 and June 2021, but it shows a very strong inflection that leaves more room for more expensive assets ($> $5,000) which account for almost 10% of the market.
At the same time, the intermediate segment (between $100 and $5,000) has also grown a lot. The big loser in this new landscape is undoubtedly the segment of the cheapest assets (<$100) which represented up to 85% of the entire market and declined to represent only 50% of sales.
The NFT ecosystem is growing faster
We are still only in the middle of the year but what has attracted our attention the most in this analysis is undeniably the number of wallets which have remained active after the initial hype that we experienced for a few weeks.
The USD indicator is certainly always interesting to observe but looking more deeply at the number of active wallets and especially new wallets gives much more precise indications on the state of the NFT market.
Despite a difficult context for all these newcomers to understand, the sector has nothing to do with previous years and has become much more accessible thanks to the efforts of the entire ecosystem!
These efforts seem to be rewarded today by a growing number of NFT users and the least we can do today is to welcome them on this adventure which, in our opinion, is still in its infancy.
The few conclusions to be drawn from these Post-Boom analyses are therefore:
- The NFT ecosystem has a very good retention rate of new users (25%)
- After the Boom and hype, the ecosystem has seen nearly 40,000 new users arrive every 2 months.
- The average price of assets in the market has increased significantly, giving rise to a segment of “very expensive” assets that only an elite can acquire.
There is undoubtedly a before and and after the Boom. The ecosystem is growing faster, appealing to more and more new users, who have already begun to shape this new era of the NFT ecosystem.