The distribution of players on blockchain gaming
[08.10.2019 UPDATE: BlockchainCuties data added to the analysis]
We proposed an initial analysis of NFT communities few weeks ago, focusing on the activity of non-fungible token traders. In other words, the first analysis focused exclusively on the addresses (users) who bought or sold an asset specific to these projects. This indicator has already revealed many things about community silos and the behavior of buyers from one project to another. We invite you to find the analysis on the NFT trading communities at this address : One global or several tiny NFT communities? Traders version
However, this first analysis was not enough to show the whole community around non-fungible tokens. Remember, buying or selling an asset is only ONE of many potential use cases. We believe today that this speculative trend is an obvious legacy of the cryptocurrency ecosystem, but it does not represent the only growth driver of the crypto-gaming / NFT ecosystem.
Today, we want to offer you a more complete analysis, covering the same 13 projects, but this time integrating ALL interactions with the smart contracts.
In other words:
- 1st analysis (traders): only transactions corresponding to the purchase or sale of an asset
- This analysis (gamers): all interactions with the game, including purchases / sales, but also in-game (on-chain) actions, such as redeeming your experience points in Axie Infinity.
Our methodology
The methodology is globally the same as for the traders analysis, we have aggregated and analyzed over 3.5 million interactions. The period analyzed is the same: from January 1st to June 30th 2019.
The following 14 projects were analyzed:
- 0xUniverse
- Axie Infinity
- Blockchain Cuties
- Chainbreakers
- CryptoPunks
- Chibifighters
- CryptoKitties
- Decentraland
- Etheremon
- Etherbots
- Neon District
- MLB Champions
- My Crypto Heroes
- MegaCryptoPolis
Our analysis focused on these different aspects:
- Adhesion rates between crypto-games (number of players in common)
- Adhesion rates between crypto-games (percentage of players in common)
- Identification and prioritization of projects according to their isolation rate (percentage of players not playing any other blockchain game)
- Number and percentage of players according to the number of blockchain games in which they are active (from 1 to 14)
Adhesion rates between crypto-games (number of players)
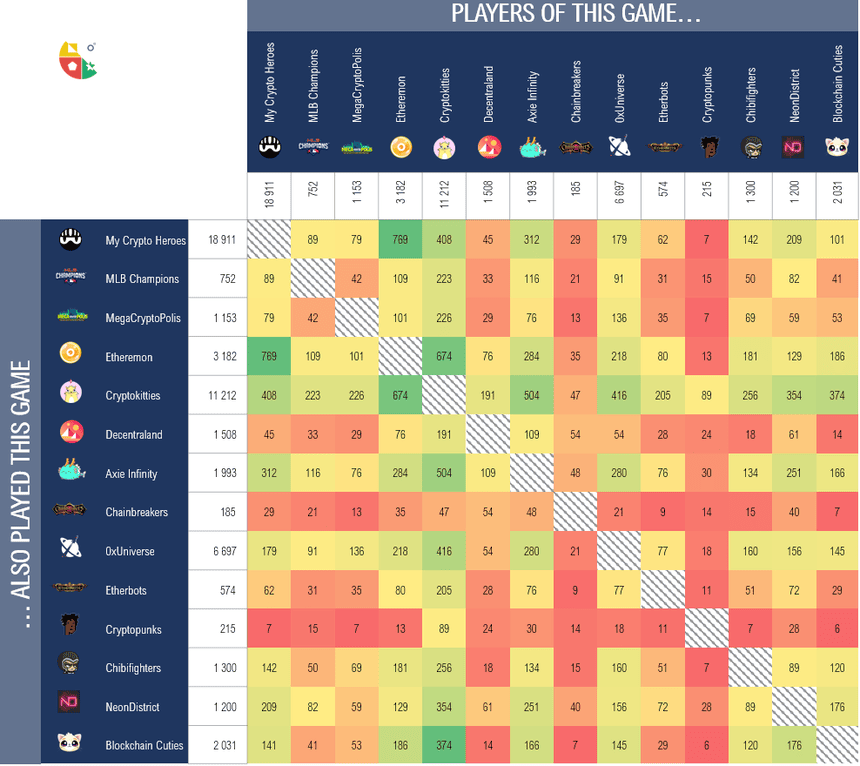
First of all, it is important to remember that this view by “Number of players” can be misleading because a small community necessarily has a small area of adherence with other communities. Thus, CryptoPunks with a community of 215 people appears in red with very few players in common with other projects.
This phenomenon is purely mechanical and related to the size of its community, it is for this reason that we recommend reading this first data in the light of the second table showing the distribution of players in percentage.
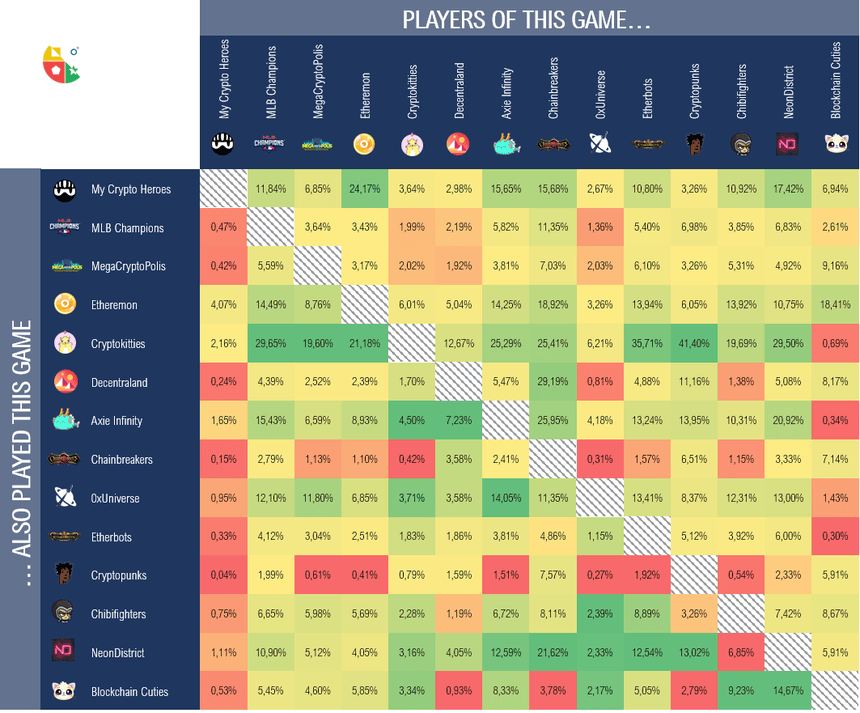
Adhesion rates between crypto-games (% of players)
Community isolation rate
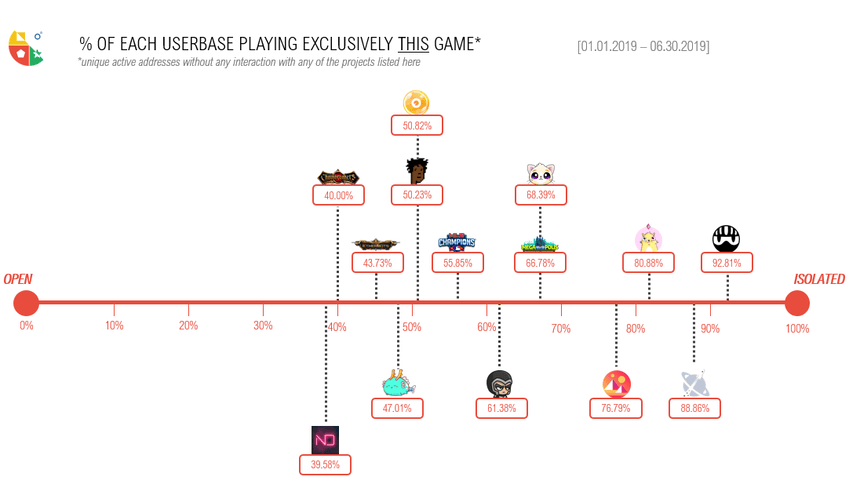
MyCryptoHeroes is by far the most “isolated” project, with 93% of players not playing a single other blockchain game.
On the contrary, Neon District is the game sharing the most players with other communities, only 39.58% of these players did not go to see other games on the period.
On average, 61.65% of players are loyal to one game.
It should be noted that the 3 projects being the most “isolated” have the largest communities (> 5,000 players). From this we conclude that these projects have been able to reach audiences far removed from the NFT ecosystem, which may explain this low porosity (apparently) with other projects.
The isolation rate is an indicator to consider with caution because this “relative isolation” can be a reflection of a very healthy development of the project towards new audiences.
Distribution of players according to the number of projects played
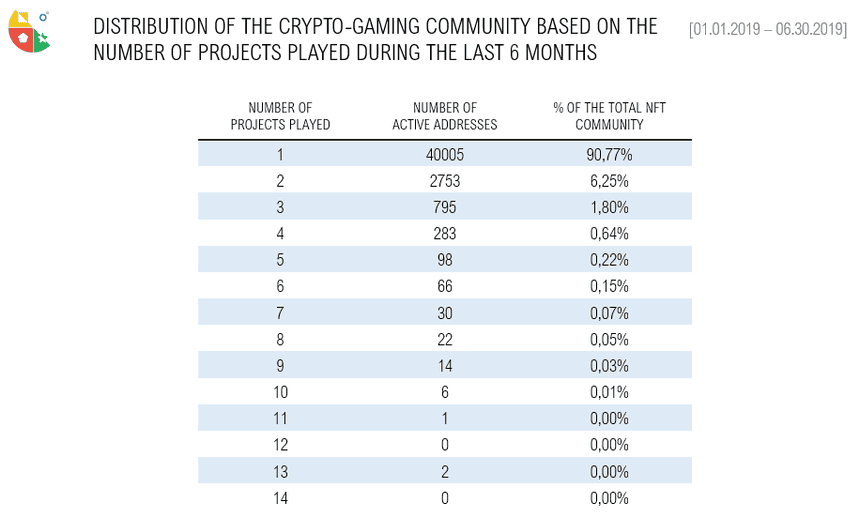
We have identified 44,075 unique active addresses across all 14 projects in the first 6 months of 2019. This statistic does not cover all players in ALL NFT projects, nor does it cover projects using the standard ERC-1155 (Enjin).
97.01% of the total community played to 1 or 2 games. This trend is slightly more pronounced for players than for traders (96%). This proves that the activity of traders is closely linked to that of gamers. Traders identifying trends, they follow the projects with a strong user base, guaranteeing the circulation of purchased assets.
We estimate the crypto-gaming community in mid-2019 to be around 50,000 players worldwide.
MyCryptoHeroes has the highest isolation rate, related to two reasons in our opinion:
- the project is much more established on the Asian market than the western one, the opposite of the other project
- the project seduced a new audience, who did not come to “discover the NFT ecosystem” but only play MyCryptoHeroes
Just like the traders’ analysis, 90.77% of the players only played one blockchain game among the 14 analyzed. This figure rises to 97% of the community if we count addresses that have been active on 1 to 2 blockchain games.